
Through Sunday, August 30, 2020
We’re working to provide you up-to-date information in this ever changing landscape we’ve found ourselves in. The below is a weekly snapshot of market activity of Park City real estate. Data provided by the Park City Board of Realtors
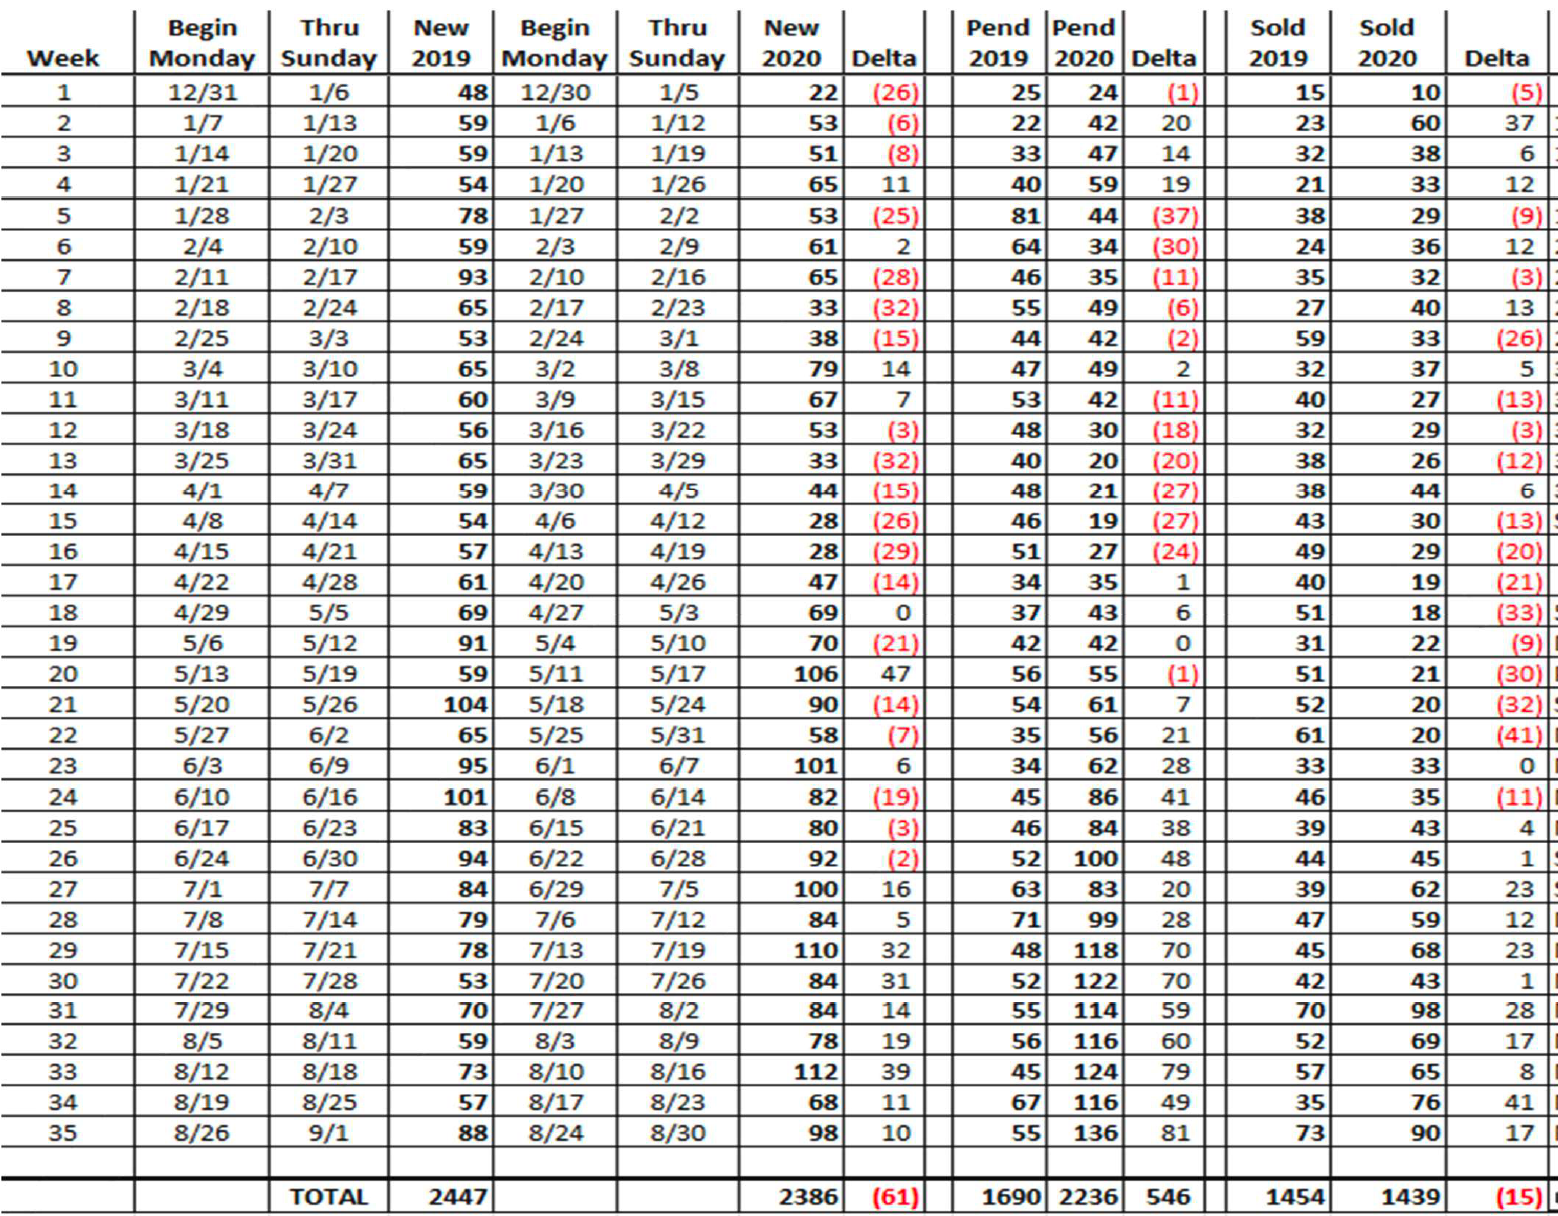
Listings have increased for the past 9 weeks and have almost caught up with the Year to Date totals from 2019. However, these listings are being absorbed by the market at record pace. Pending Sales set a new record this week with 136 vs. 55 in 2019. There have been 546 more Pended Sales Year to Date than in 2019. The demand has far exceeded the supply which has resulted in multiple offers on many listings and a 9.29% median price increase this year. Sold/Closed Sales are very strong as the record number of pending sales cross the finish line. Closed sales have now almost caught up to 2019 totals. The activity in the market is creating unique opportunities for buyers and sellers who want to move up or downsize. Low interest rates and a desire for buyers to participate in our fabulous Wasatch Back lifestyle may continue this trend for the foreseeable future. |
 |
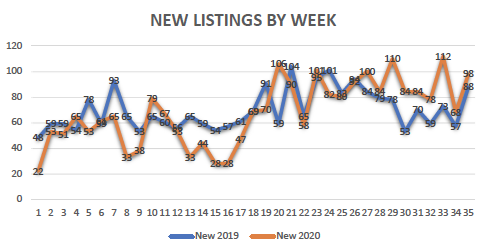 |
New Listings From our bottom in mid-April we have seen the market rebound into May, then zig-zag against last year’s number until our breakout the last week in June. Since then, we have seen nine solid weeks of sustained numbers higher than last year. If we stay on that pace, we stand a good chance of passing the YTD total for 2019. We closed the gap to just 61 listings and we’re gaining on it. Meanwhile, agents are running out of ink writing a record number of contracts as we see in the Pending numbers below. |
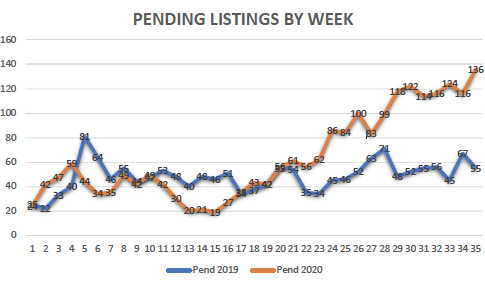 |
Pending Listings Pending contracts hit parity with 2019 the week of April 26. They tracked in unison for five weeks. Then all heck broke loose, and contract writers have been on a tear ever since. This week we broke the record set two weeks ago with 81 more contracts (136 vs. 55) written than in the same week last year. Pendings (homes going under contract) are perhaps the best leading indicator of market demand from the buyer side. And our buyer-side is strong and getting stronger. After a bottom in mid-April, in the nineteen weeks since, total Pendings in 2020 total 1652 compared to 947 in 2019, a 74% increase in pending volume. |
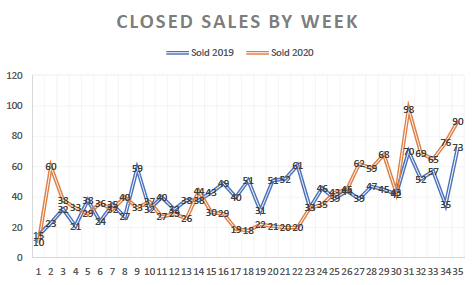 |
Closed Sales Closings this past week (90) once again pointed our chart upward, and topped last year’s weekly total by more than 20%. marking the eleventh week of the last thirteen where this year out-performe last (we had one tie). As with Pending contracts, the gap over last year is growing larger. Total closings in the past eleven weeks were up from 543 in 2019 to 718 in 2020, a 32% increase. |
Park City MLS – Activity Report
Share This Story, Choose Your Platform!
Related Posts


Leave A Comment